Event Summary Overview
The Event Summary page serves as the central hub for managing all events in Alert Manager Enterprise (AME).

In AME, an Event refers to a Splunk Alert managed by the app. A Splunk Alert can append to an existing AME event. See Alert Action Setup for details on event creation and updates.
AME supports the Splunk Dark UI theme, configurable via Splunk User Preferences.
Single Value Indicators
Single Value Indicators at the top of the Event Summary display the number of events within the selected time range, split by priority, with a trend timeline below.
Toggle visibility with these buttons:
| Button | Function |
|---|---|
 | Show Single Values |
 | Hide Single Values |
Event Timeline
The Event Timeline, displayed below the Single Value Indicators, shows events over the selected time range, split by priority.
Toggle visibility with these buttons:
| Button | Function |
|---|---|
 | Show Event Timeline |
 | Hide Event Timeline |
About Priorities
Priorities are derived from an alert’s urgency and impact settings:
| Impact | Urgency | Priority |
|---|---|---|
| low | low | informational |
| low | medium | low |
| low | high | medium |
| medium | low | low |
| medium | medium | medium |
| medium | high | high |
| high | low | medium |
| high | medium | high |
| high | high | critical |
Event Table
The Event Table displays these default fields:
- Title
- Tenant
- Status
- Priority
- Assignee
Fieldsets
If fieldsets are defined for the selected tenant, a fieldset dropdown appears:

Fieldsets are tenant-specific and visible only when events from a single tenant are displayed.
Alert result field values require AME 3.2 or higher to be displayed.
Table Colummn Sorting and Field Filters
Columns can be sorted and filtered. Click on the up-and-down arrow to open the settings.
Select the sort order and apply a filter. Filtering supports wildcards.

Active Field Filters are also visible in the Filters settings.
Copyable Cell Data
If configured for the selected fieldset, the cell shows a copy button.

Event Actions
Event Actions are split into Primary Actions and Secondary Actions

Event Actions can be customized (see Event Action Configuration)
Primary Actions
By default, following primary actions are available:
| Button | Function |
|---|---|
 | Change Assignee |
 | Change Status |
Secondary Actions
The Secondary Actions menu offers these options:
- Edit Tags
- Adjust Notification Scheme
- Adjust Urgency
- Add Resolution
- Delete Event
- Display Action Fields
- Run Drilldown Search (traces the originating Splunk search)
For more on managing events, see Working with Events.
Event Details
Click an event in the accordion table to view its details. Default top-level information includes:
- Event ID: The internal AME Event ID
- First Seen: The timestamp of the first grouped event
- Notification: The name and link to the notification scheme
- Count: The number of grouped events with the same title
- End-time (TTL): If a TTL is set, the estimated endtime of the TTL. The reaper process runs asynchronously.
- Template: The name and link to the template
- Resolution
- Search: The name and link to the search
- Description: The description stored within the saved search. Markdown is supported.
- Tags
- Action Fields

Opening an event provides additional tabs:
- Notable Fields
- Data
- History
- Comments
- SLAs
- Risk Events
- Observables
- Ticketing Integration

Event Details Tab Ordering
Adjust tab order in Tenant Configuration:
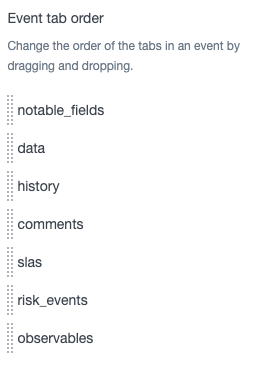
Requires an AME subscription.
Compact vs. Expanded View
The default Compact View shows limited details and requires opening an event for full visibility. The Expanded View displays selected attributes directly.
Switch views with these buttons:
| Button | Function |
|---|---|
 | Compact View |
 | Expanded View |
See Working with Events for details. Configure Expanded Views in Event Summary Configuration.
Displaying notables, tags, and customizing Notable/Event Fields require an AME subscription.
Filters
Filter displayed events using these buttons:
| Button | Function |
|---|---|
 | Open Filter |
 | Reset Filter |
 | Show Filter In-Page |
Filters appear on the right as a slide-out or in-page panel:

Available filters include:
- Time (default: Last 7 days)
- Tenant
- Title
- Assignee
- Priority
- Tags
- Status
- Resolution
- Search
- Saved Search
- SLA Filters
- Field Filters
Filtering by Search
The Search field uses Splunk syntax, supporting:
event_keyevent_titlefields.field_name- Free text
Applying Filters
Click Apply Filter or press Ctrl+Enter to apply.
Field Filters
Field Filters are only shown, when a user has activated them through the table column settings. Active filters can be adjusted or deleted.
Examples
vulnerability fields.dvc="host-1" OR fields.dvc="host-2"
event_title="Disk Usage*" OR event_title="High Memory*" fields.dvc="server-*"
Saved Filters
Save the current filter by clicking Save Current Filter, opening a modal:
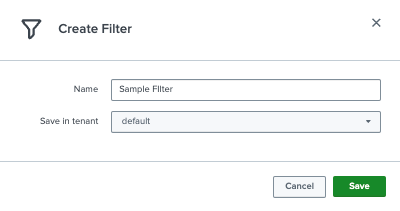
Select saved filters from the dropdown next to Save Current Filter. Selected filters can be updated, renamed, or deleted.
Requires an AME subscription.
Refresh Interval
Set or disable the Event Summary refresh interval with this button:
| Button | Function |
|---|---|
Refresh Interval |
Options:
- No Refresh
- 1 Minute
- 5 Minutes
- 15 Minutes
- 30 Minutes
- 1 Hour
Footer
The following information is shown in the footer:
- time range select
- event count
- last reload time
- applied filter name
Toggle visibility with these buttons:
| Button | Function |
|---|---|
 | Hide Footer |
 | Show Footer |