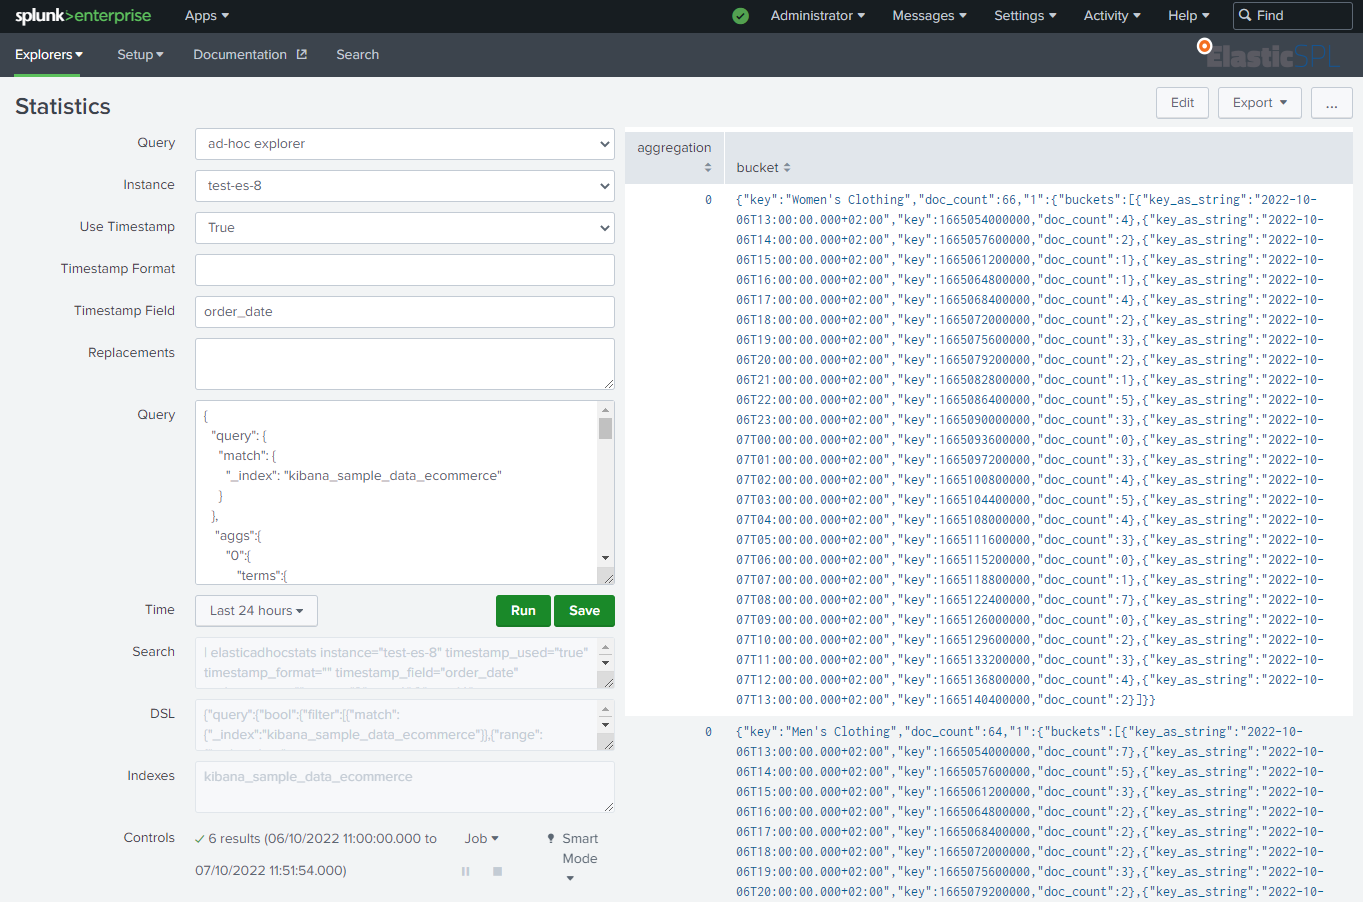
Explorer Statistics
The explorer dashboard for statistic queries allows running ad-hoc queries using an interactive interface. Compared to elasticadhocstats the DSL query is provided as a proper JSON object.
In addition to running ad-hoc queries, the dashboard shows the DSL query run after parsing and the ad-hoc version of the command. The Save button creates a saved query based on the provided values. To explore saved queries, the stored values are loaded by selecting the query in the drop down.
Examples
Get timechart for sold items in the last 24h by category from index kibana_sample_data_ecommerce
- Query:
ad-hocexplorer - Instance: the required instance
- Use Timestamp:
true - Timestamp Field:
order_date - Replacements:
- Query:
{
  "query": {
    "match": {
      "_index": "kibana_sample_data_ecommerce"
    }
  },
   "aggs":{
      "0":{
         "terms":{
            "field":"category.keyword",
            "order":{
               "_count":"desc"
            },
            "size":100
         },
         "aggs":{
            "1":{
               "date_histogram":{
                  "field":"order_date",
                  "calendar_interval":"1h",
                  "time_zone":"Europe/Zurich"
               }
            }
         }
      }
   },
   "size":0,
   "fields":[
      {
         "field":"customer_birth_date",
         "format":"date_time"
      },
      {
         "field":"order_date",
         "format":"date_time"
      },
      {
         "field":"products.created_on",
         "format":"date_time"
      }
   ],
   "script_fields":{

   },
   "stored_fields":[
      "*"
   ],
   "runtime_mappings":{

   },
   "_source":{
      "excludes":[

      ]
   }
}
