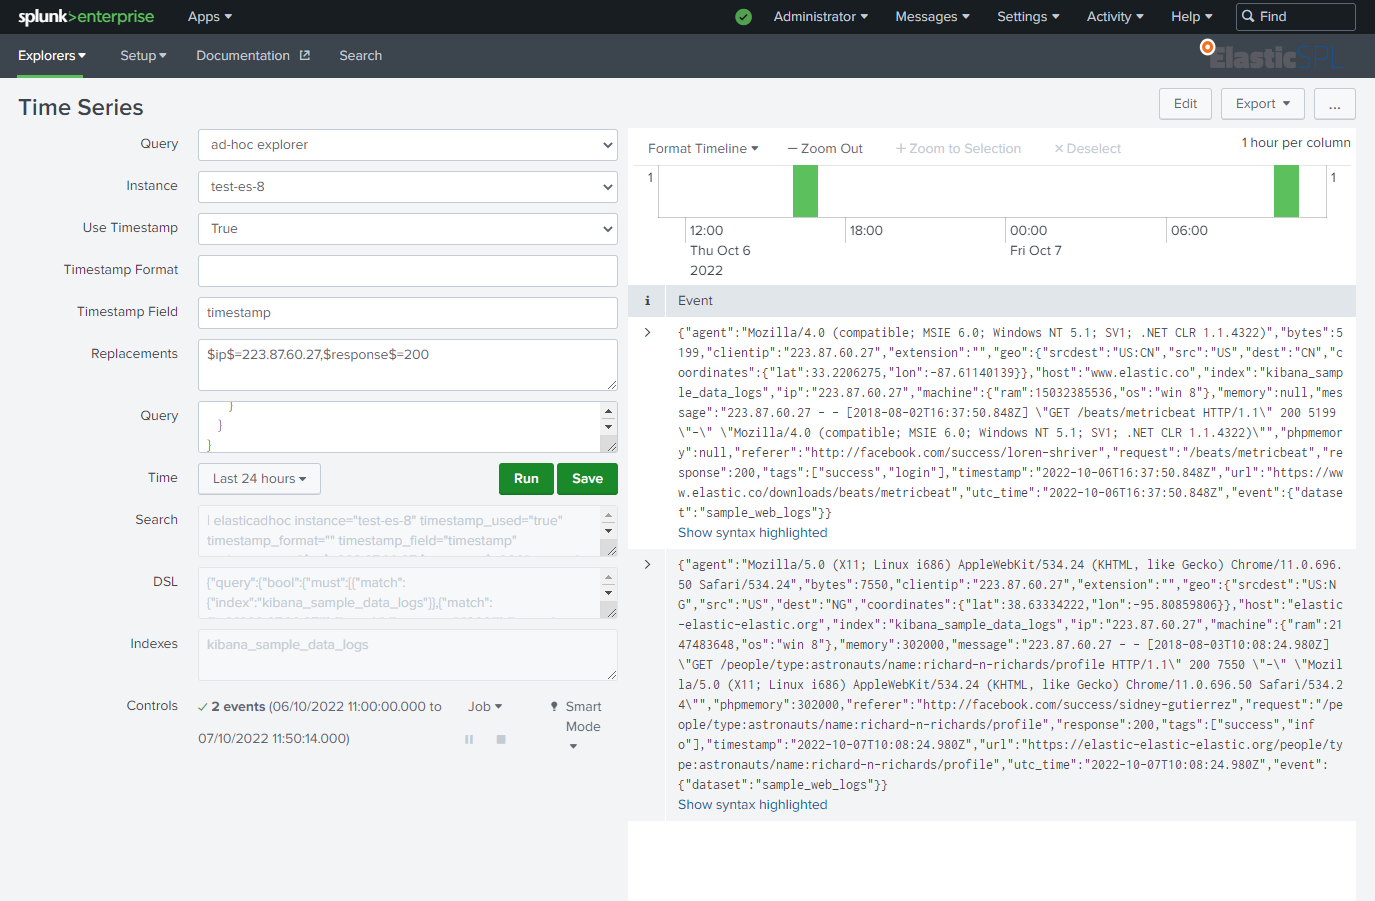
Explorer Time Series
The explorer dashboard for statistic queries allows running ad-hoc queries using an interactive interface. Compared to elasticadhoc the DSL query is provided as a proper JSON object.
In addition to running ad-hoc queries, the dashboard shows the DSL query run after parsing and the ad-hoc version of the command. The Save button creates a saved query based on the provided values. To explore saved queries, the stored values are loaded by selecting the query in the drop down.
Examples
Get weblog from kibana_sample_data_logs for the last 30days with ip= and status=200
- Query:
ad-hocexplorer - Instance: the required instnace
- Use Timestamp:
true - Timestamp Field:
timestamp - Replacements:
$ip$=223.87.60.27,$response$=200 - Query:
{
   "query":{
      "bool":{
         "must":[
            {
               "match":{
                  "index":"kibana_sample_data_logs"
               }
            },
            {
               "match":{
                  "ip":"$ip$"
               }
            },
            {
               "match":{
                  "response":"$response$"
               }
            }
         ]
      }
   }
}
